Senior Editor: Alan Agbele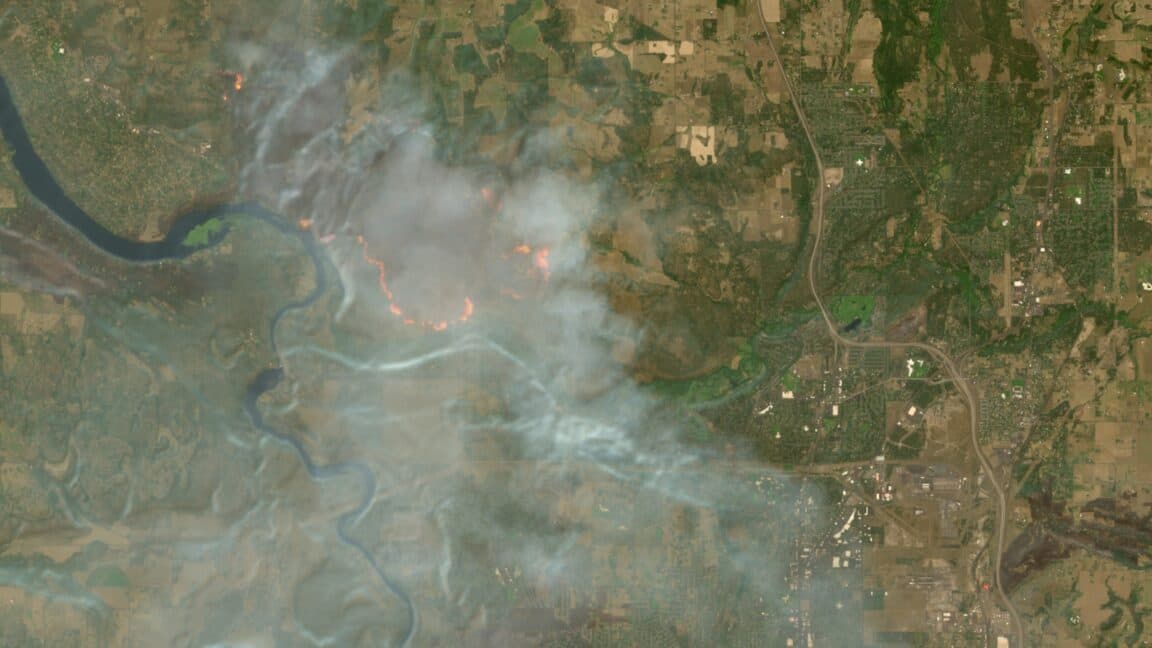
Anyone with an internet connection can now see active wildfires and burn scars in near real time using Europe’s free satellite imagery service. The Copernicus Browser, operated by the European Space Agency, added a dedicated wildfires visualization layer for its Sentinel-2 mission on August 4. The layer translates raw spectral data into an intuitive color scheme: white or yellow for active flames, red for burning vegetation and dark brown or black for scorched landscapes.
How the Wildfire Layer Works
The layer draws on a visualization script developed nearly a decade ago, now integrated directly into the Copernicus Browser interface. Users simply select the “wildfires” option from the default visualization layers while viewing a location affected by fire. The Sentinel-2 satellites revisit the same area every five days, allowing frequent updates of fire progression and burn extent.
A Decade-Old Script Finds New Purpose
The underlying script dates back to early efforts to process Sentinel-2 data for fire monitoring. It was originally shared among researchers and gradually refined. By embedding it as a one-click layer, the Copernicus team eliminated the need for manual band combination or software downloads. This move mirrors a broader trend in Earth observation: making complex satellite data accessible to non-specialist users.
Why This Matters
Wildfire seasons are intensifying globally due to climate change, putting more communities and ecosystems at risk. The free layer lowers the barrier for local authorities, journalists and citizens to assess fire danger and damage without expensive satellite subscriptions or technical training. It also enables faster coordination among disaster response teams by providing a common visual reference. Over time, this could influence how governments deploy resources and communicate fire risk to the public.
Future of Open Satellite Data
The European Space Agency and its Copernicus program have long championed free and open data policies. The new visualization layer is a direct application of that philosophy and may set a precedent for other types of environmental monitoring. As satellite constellations expand, similar one-click layers for floods, droughts or air quality could follow, further democratizing access to space-based observations.